Histogram Calculator - A Java Applet
Friday, April 29, 2005
A wise man once said:
Oh, people can come up with statistics to prove anything. 14% of people know that.
Homer Simpson
Statistics is one of the misunderstood fields of Mathematics. In the wrong hands it can be used to lie and manipulate and most of the time to wrongly predict sunny skies: "...30% chance of rain..." Sure.
The true value of statistics is in the power of prediction and analysis of any type of phenomena. I.e. By measuring the results of a process many times over we can generate graphs from the recorded data and we can calculate averages and standard deviations to make generalizations about the process.
Histograms are like frequency charts, but different. I.e. The 'y' axis is really the percentage of a certain event occurring in a set of observed events. The big secret: divide the frequency by the total number of elements to get the relative frequency :)
Anyway, the
Histogram Calculator accepts a set of data - numbers separated by spaces, tabs, or 'enters' - And when you click the "Draw Histogram" button a histogram from the data given is drawn, together with a quick summary of the data. I've also added a plot of the Normal distribution for good measure.
For this Java applet I haven't included the source code (I usually do). I'm too lazy to comment it. But, if you are really eager you can decompile the classes and figure out what's going on.
Another thing to note is that the applet is not 1.0 compliant. You can thank Microsoft for not including a JVM in your IE browser and my laziness for not porting it to be JDK 1.0 compliant. So, in order to see it running you need to have the Java plug-in installed for your browser of choice. Chances are, you already have the Java plug-in installed.
A quick peek at the codeThe Normal probability density function is a funky looking formula that can be derived using some funky calculus:
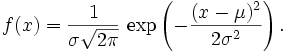
This curve is part of the
Gaussian family of curves. Lots of
e's and
π's in it.
My Java implementation looks like this:
private double getProbability(double z) {
    return (1.0 / Math.sqrt(2.0 * Math.PI))
    * Math.exp(-0.5 * z * z);
}
That's straight forward, I think. Now plotting the function is a bit more fun. Java2D doesn't have a Cartesian plane pre-defined, hence you must calculate everything by hand.
Note that
getProbability(double z) expects a normalized parameter. This means that the 'z' parameter needs to be of the form:
z = (value - mean) / sd.
Go to the Applet...
Comments:
There is a problem with the normal curve plotter - I'm loosing the scaling factor, hence the points are all out of wack.
If I have some free time, I'll take a shot at fixing it.
I fixed the normal curve plotter. The curve is properly displayed for most data sets I tried.
I had some free time after all - Well, maybe not free: I shaved off an hour or so from my daily sleeping time segment.