Invest $1,000 and make $34,991.97, but only in theory
Tuesday, May 15, 2007
One of the greatest things about North American stock markets is that every snippet of information is stored somewhere. Every closing price, every split of stock, and every CEO firing and hiring is available to be scrutinized.
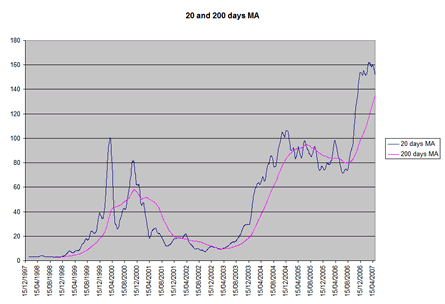
Another great thing is that some information is free, for example, historical stock prices. With this type of data you can create pretty pictures such as the one below:

The picture itself gives you a great deal of information and not just aesthetic satisfaction. From reading the graph I can tell you that if I had invested $1,000 in this particular stock I would have made $34,991.97 (if I had liquidated my holdings on May 8, 2007).
Of course, I didn't make that money because I didn't invest it, but the fact remains that I should have--the data doesn't lie. Or does it?
First of all, let me explain what the graph is.
I created it using a 20 day moving average and 200 day moving average of closing stock prices for the last 10 years (in the graph, the 20 MA is blue and the 200 MA is pink).
I won't go into the details of what a moving average is. All we need to know right now is that using this graph technical analysts would argue that when the 20 day moving average is above the 200 day moving average then one should
buy the stock, and if it is below (20 < 200) then one should
sell it.
(Note that this is only one aspect of what a technical analyst does with this type of data.)
Being a software developer/engineer, I had to put the concept into code. Hence, using the simple rule above, I wrote a little Java program that takes in the closing prices of the stock (Yahoo's Excel export), calculates the 20 day and 200 day moving average, and then at each intersection determines if I should have bought or sold the security.
For this particular graph, there are 25 intersections (as you can see in the image above), and,
according to my program, if I would have invested $1,000 I would have made $34,991.97--this is not counting transaction fees, and allowing for fractional holdings. I didn't want to put too many rules in the code, as we are talking quick and dirty, yet elegant (note: code should always, always be elegant).
The question is if this particular stock had the potential to make so much money, does every other stock behave similarly? Well, yes and no. This rule holds from time to time, but around the 90s it didn't work so well.
The problem is that it is backwards looking, i.e., it tries to predict future prices based on historical data. And this, as some of you know, is not the best way to look at investments: portfolio performance of years ago, will have no bearing in what it will do tomorrow. So if your mutual fund manager tells you that his or her fund generated returns of 25% last year, it should mean nothing today--it could have been 1000% return and it would still not guarantee you a half percentage point of next year's returns. (To be fair, fund management companies put a small--very small--disclaimer when they publish their yearly reports.)
In fact, fundamental analysts scold at the idea of using statistics to determine stock prices. They have a point: stock returns and stock prices are quite random. There is no other way the stock market would work, i.e., if I can take advantage of such silly rules, then everyone could and that would even out the prices.
Regardless of all the ifs and buts, I still like the graph (and my program). And I like the fact that in theory this rule works. However, I have it from a
pretty good source that these type of tactics don't work so well in real life (at least not on a consistent basis to be predictable).
Of course, there has to be super-rich technical analyst to contradict such claims: to paraphrase Eminem, I say "will the real technical analyst, please stand up. Please stand up..."
Comments: